Red Hat’s release of OpenShift Service Mesh 3 marks the arrival of Ambient Mode, a sidecar-less data plane built on the latest Istio standards. This evolution streamlines mesh deployment by removing architectural complexity while keeping security and observability at the forefront.
This guide demonstrates how to configure Ambient Mode using the following stack:
- OpenShift Container Platform: 4.18.32
- OpenShift Service Mesh Operator: 3.2.2
- Istio: 1.27.5
- Istio CNI: 1.27.5
- Ztunnel: 1.27.5
What Is Ambient Mode?
Ambient Mode represents a fundamental shift in how mesh services are delivered, moving away from the “sidecar-per-pod” model. Unlike the traditional approach, which requires an Envoy proxy to be injected into every application pod, Ambient Mode decouples the data plane from the application lifecycle. This eliminates the need for container restarts during mesh updates and reduces the resource footprint of your cluster.
Please see the different architecture diagram between Sidecar mode vs Ambient mode:

More detail architecture diagram in multiple namespaces:
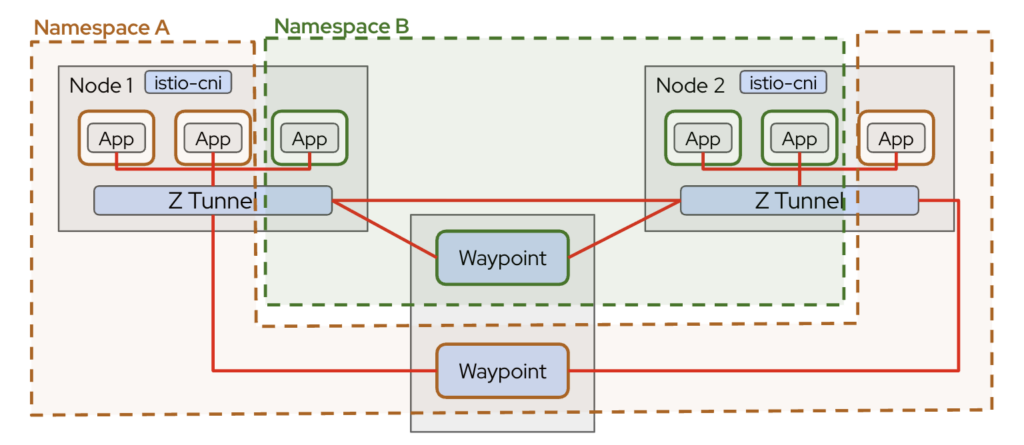
The core component is ztunnel, deployed as a DaemonSet on every node. It handles Layer 4 responsibilities such as mutual TLS (mTLS), workload identity, and secure east-west traffic. Traffic is transparently redirected by Istio CNI to ztunnel, allowing workloads to communicate securely without sidecars.
For advanced Layer 7 features like HTTP routing, traffic splitting, or authorization policies, waypoint proxies can be deployed selectively. This layered design separates secure transport from application-level routing, making Ambient mode lightweight, modular, and easier to scale.
This makes Ambient Mode ideal for:
- Large clusters
- Gradual mesh adoption
- Lower operational overhead environments.
Enabling Ambient Mode in OpenShift
To enable Ambient mode in OpenShift Container Platform, start by installing the OpenShift Service Mesh Operator version 3.2.1 from OperatorHub. The operator manages the lifecycle of the Istio control plane, Istio CNI, and ztunnel components required for Ambient mode. Once installed, create an Istio custom resource using the ambient profile. This profile automatically enables the necessary Ambient data plane components, including ztunnel and CNI-based traffic redirection, without requiring sidecar injection.
Please note (important), you have to ensure that the OVN-Kubernetes Container Network Interface (CNI) uses local gateway mode by setting the routingViaHost field as true in the gatewayConfig specification for the Cluster Network Operator.
$ oc get network.operator -oyaml cluster | yq .spec.defaultNetwork.ovnKubernetesConfig.gatewayConfig
ipForwarding: Global
ipv4: {}
ipv6: {}
routingViaHost: true
Istio
While Ambient mode changes the data plane architecture, the control plane remains the brain of the service mesh, responsible for configuration distribution, security, and policy management.
The primary component of the control plane is istiod. It performs several critical functions:
- Configuration management – Processes Kubernetes custom resources such as
VirtualService,DestinationRule,PeerAuthentication, andAuthorizationPolicy. - Certificate management – Issues and rotates workload certificates for
mTLS. - Service discovery – Watches the Kubernetes API for services, endpoints, and namespaces.
- Policy distribution – Pushes configuration to ztunnel and waypoint proxies.
apiVersion: sailoperator.io/v1
kind: Istio
metadata:
  name: default
spec:
  namespace: istio-system
  version: v1.24.3
  telemetry:
    enabled: true
    prometheus:
      enabled: true
      replicaCount: 1
      resources:
        requests:
          memory: 512Mi
          cpu: 250m
        limits:
          memory: 1Gi
          cpu: 500m
  values:
    pilot:
      trustedZtunnelNamespace: ztunnel
      autoscaleEnabled: true
      autoscaleMin: 1
      autoscaleMax: 5
      cpu:
        targetAverageUtilization: 70
    profile: ambient
    meshConfig:
      discoverySelectors:
        - matchLabels:
            istio-discovery: enabled
      enableTracing: true
      accessLogFile: /dev/stdout
  updateStrategy:
    type: InPlace
    inactiveRevisionDeletionGracePeriodSeconds: 30
Although there are no sidecars in Ambient, the control plane logic is largely the same. It still maintains workload identities based on ServiceAccounts and enforces zero-trust security principles across the cluster.
IstioCNI
In OpenShift Service Mesh 3, IstioCNI handles traffic redirection in Ambient mode without sidecars. It runs as a DaemonSet and modifies pod iptables to route traffic through ztunnel, enabling secure mTLS communication and policy enforcement.
Istio CNI allows Ambient mode to work namespace by namespace, ensuring only labeled workloads participate in the mesh. While it redirects traffic, metrics are collected by ztunnel (L4) and optional waypoint proxies (L7). In short, Istio CNI is the glue that connects pods to ztunnel, providing a lightweight, sidecar-free service mesh.
kind: IstioCNI
apiVersion: sailoperator.io/v1
metadata:
  name: default
spec:
  namespace: istio-system
  profile: ambient
  values:
    cni:
      ambient:
        reconcileIptablesOnStartup: true
Ztunnel
Ztunnel is the core L4 proxy in Ambient mode for OpenShift Service Mesh 3.2.1. Unlike traditional sidecars, it runs as a DaemonSet on each node (by default, unless you use nodeSelector) rather than inside every pod, handling secure pod-to-pod communication transparently.
Ztunnel is responsible for:
- Mutual TLS (mTLS) – Encrypts traffic between workloads.
- Workload identity enforcement – Uses Kubernetes ServiceAccounts to verify identities.
- Traffic redirection – Receives pod traffic via Istio CNI and forwards it securely to the destination.
Because it operates at Layer 4, ztunnel is lightweight and reduces per-pod resource overhead, while still providing zero-trust security and basic observability. For Layer 7 features like HTTP routing, retries, or authorization, waypoint proxies are deployed on top of ztunnel.
apiVersion: sailoperator.io/v1
kind: ZTunnel
metadata:
  name: default
spec:
  namespace: ztunnel
  profile: ambient
  values:
    ztunnel:
      logLevel: info
      terminationGracePeriodSeconds: 30
After the control plane is ready, Ambient mode is activated at the namespace level. Simply label the target namespace with istio.io/dataplane-mode=ambient. Workloads inside that namespace will automatically participate in the Ambient mesh, with traffic transparently redirected through ztunnel. Unlike sidecar mode, no application pod restart or proxy injection is required, making onboarding significantly simpler and less disruptive.
kind: Namespace
apiVersion: v1
metadata:
name: webstore
# Labels needed for ambient dataplane mode
labels:
istio-discovery: enabled
istio.io/dataplane-mode: ambient
istio.io/use-waypoint: webstore-waypoint
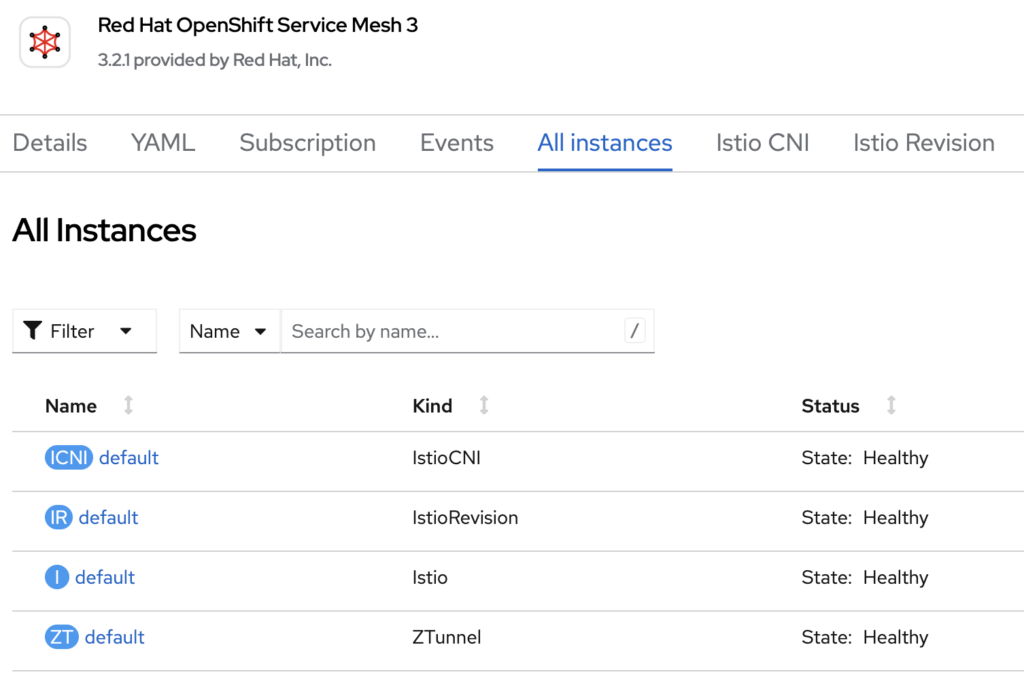
ambient.istio.io/redirection: enabledOnce you have deployed Istio, IstioCNI, and Ztunnel, you will see the status of those from OpenShift Service Mesh 3 operator page:
Pod Monitor
A PodMonitor is useful when you want Prometheus to scrape metrics directly from specific pods, such as ztunnel running as a DaemonSet. This is often the preferred approach for infrastructure components where metrics are exposed per pod.
apiVersion: monitoring.coreos.com/v1
kind: PodMonitor
metadata:
  name: istiocni-podmonitor
  namespace: istio-system
  labels:
    app: webstore
spec:
  selector:
    matchLabels:
      app.kubernetes.io/instance: istio-cni
  podMetricsEndpoints:
    - port: metrics
      path: /metrics
      interval: 30s

---
apiVersion: monitoring.coreos.com/v1
kind: PodMonitor
metadata:
  name: ztunnel-monitor
  namespace: ztunnel
  labels:
    release: istio
spec:
  selector:
    matchLabels:
      app: ztunnel
  namespaceSelector:
    matchNames:
      - ztunnel
      - istio-system
  podMetricsEndpoints:
    - path: /stats/prometheus
      port: ztunnel-stats
      interval: 15s
      relabelings:
        - action: replace
          replacement: "ztunnel"
          targetLabel: component
Service Monitor
A ServiceMonitor, on the other hand, is used when metrics are exposed behind a Kubernetes Service. This is common for applications or waypoint proxies where traffic is routed through a Service abstraction.
apiVersion: monitoring.coreos.com/v1
kind: ServiceMonitor
metadata:
  name: istiod-monitor
spec:
  targetLabels:
  - app
  selector:
    matchLabels:
      istio: pilot
  endpoints:
  - port: http-monitoring
    interval: 30s
In pure Ambient deployments without waypoint proxies, you will mainly observe Layer 4 metrics from ztunnel. If you require detailed HTTP metrics (requests, response codes, latency per route), you must deploy waypoint proxies and configure appropriate ServiceMonitor or PodMonitor resources to scrape them.
In short:
- Use PodMonitor for ztunnel and per-pod infrastructure metrics.
- Use ServiceMonitor for services exposing metrics via a Kubernetes Service.
- Deploy waypoint proxies if L7 observability is required.
Ambient mode simplifies the data plane, but proper Prometheus configuration remains essential for full visibility.
PeerAuthentication
In Ambient:
- mTLS is automatically enabled between workloads
- Identity is derived from ServiceAccount
- ztunnel enforces encryption transparently
Example PeerAuthentication for STRICT mode:
apiVersion: security.istio.io/v1beta1
kind: PeerAuthentication
metadata:
  name: default
  namespace: webstore
spec:
  mtls:
    mode: STRICT
Waypoint Gateway
The Waypoint Gateway is the component responsible for Layer 7 (L7) processing. While ztunnel secures traffic at Layer 4 using mTLS, it does not perform HTTP-aware routing, authorization, or advanced traffic management. That responsibility shifts to waypoint proxies.
A Waypoint Gateway is essentially an Envoy-based proxy deployed for a namespace or service account when L7 capabilities are required. It enables features such as:
- HTTP routing and traffic splitting
- Retry and timeout policies
- JWT validation
- AuthorizationPolicy enforcement at L7
- Detailed HTTP metrics
apiVersion: gateway.networking.k8s.io/v1
kind: Gateway
metadata:
  name: webstore-waypoint
  namespace: webstore
  labels:
    istio.io/waypoint-for: all
spec:
  gatewayClassName: istio-waypoint
  listeners:
  - name: mesh
    port: 15008
    protocol: ALL

---
apiVersion: monitoring.coreos.com/v1
kind: PodMonitor
metadata:
  name: waypoint-podmonitor
  namespace: webstore
  labels:
    app: webstore
spec:
  selector:
    matchLabels:
      istio.io/waypoint-for: all
  podMetricsEndpoints:
    - port: metrics
      path: /metrics
      interval: 30s
Waypoint gateways are typically deployed per namespace to centralize L7 control without reintroducing per-pod sidecars. This approach reduces resource consumption compared to traditional sidecar mode while still providing full application-layer traffic management when needed.
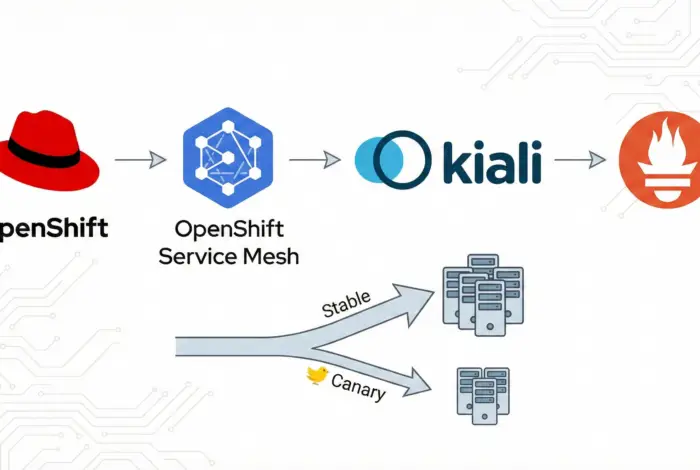
Kiali
Kiali is the observability dashboard for OpenShift Service Mesh, providing insight into service-to-service communication, traffic flow, and mesh health. Even in Ambient mode, Kiali remains a key tool for monitoring the mesh, although the telemetry model differs slightly compared to traditional sidecar deployments.
In Ambient mode:
- Layer 4 Metrics – Kiali can visualize traffic between workloads through ztunnel, including connection counts, throughput, and mTLS status.
- Layer 7 Metrics – If waypoint proxies are deployed, Kiali can also show HTTP request details, latency, and error rates per route.
- Topology Visualization – Provides a real-time graph of service dependencies, helping you identify bottlenecks or misconfigurations.
- Integration with Prometheus – Kiali relies on Prometheus to collect metrics, which are scraped from ztunnel pods (via PodMonitor) and waypoint proxies (via ServiceMonitor).
Kiali is particularly useful in Ambient mode for quickly confirming that workloads are securely connected, observing mTLS enforcement, and identifying traffic patterns without per-pod sidecars. It allows operators to maintain full visibility into the mesh while benefiting from the lightweight, sidecar-free architecture.
In short, Kiali bridges the gap between lightweight Ambient data plane and full observability, giving both security and operational insights in one dashboard.
apiVersion: kiali.io/v1alpha1
kind: Kiali
metadata:
  name: kiali
  namespace: istio-system
spec:
  version: default
  deployment:
    cluster_wide_access: true
    accessible_namespaces:
      - "**"
    namespace: istio-system
    pod_labels:
      sidecar.istio.io/inject: 'false'
  auth:
    strategy: openshift
  external_services:
    grafana:
      enabled: false
    prometheus:
      auth:
        type: bearer
        use_kiali_token: true
      thanos_proxy:
        enabled: true
      url: 'https://thanos-querier.openshift-monitoring.svc.cluster.local:9091'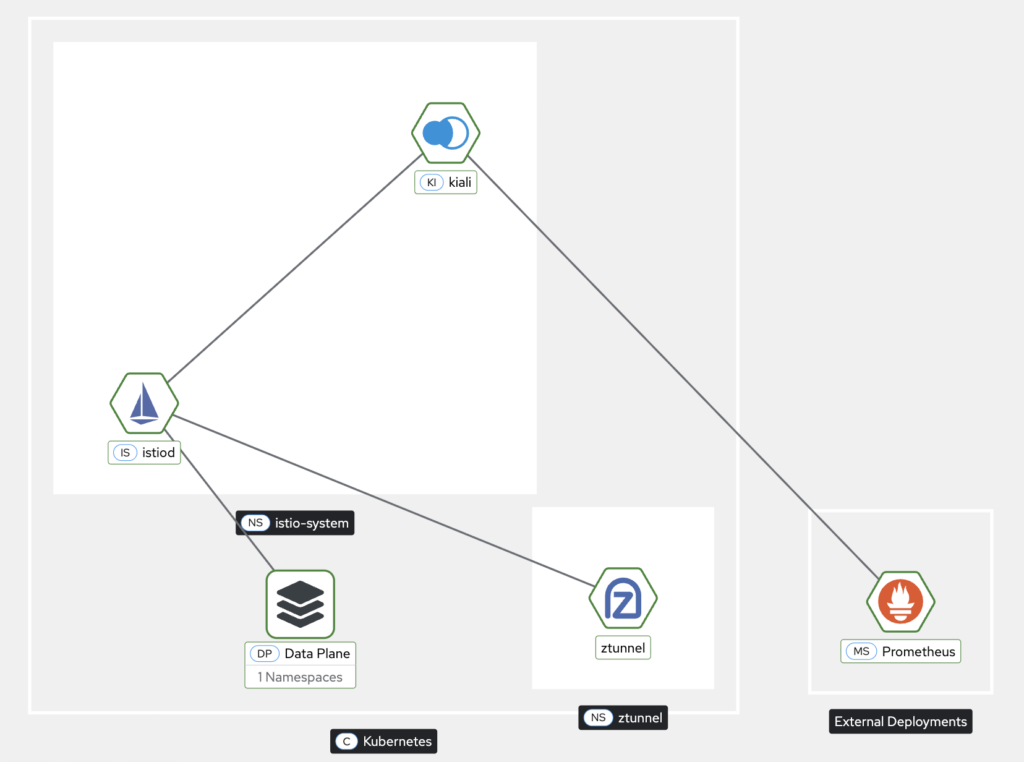
After running several tests to simulate service-to-service communication, you can now visualize the traffic and interactions directly in the Kiali dashboard
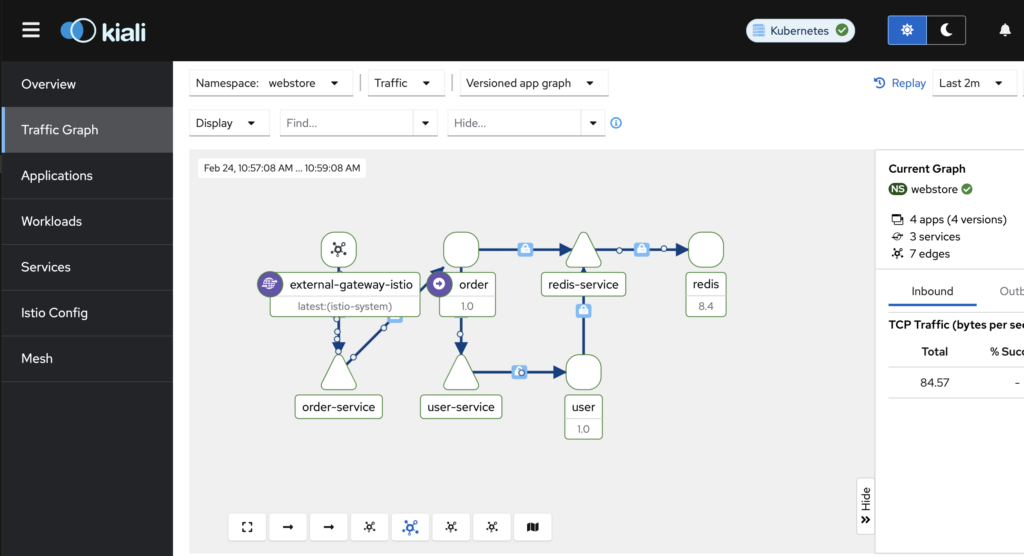
After enabling mTLS in Ambient mode, you can observe the secured connection flow directly in the Kiali dashboard. Even without sidecars injected into each workload, Kiali displays service-to-service edges with a lock icon or “mTLS” annotation, indicating that traffic is encrypted and authenticated between workloads via the ambient proxies. This provides a clear, visual confirmation that all communication in the mesh is secured, while leveraging Ambient mode’s sidecar-less architecture.
Summary
After successfully setting up OpenShift Service Mesh 3 in Ambient mode, the cluster now runs a sidecar-free service mesh where ztunnel handles secure Layer 4 traffic with mTLS and workload identity, and Istio CNI transparently redirects pod traffic. Optional waypoint proxies provide advanced Layer 7 routing and policy enforcement where needed.
Observability is fully enabled through Kiali, with Prometheus collecting metrics via PodMonitor and ServiceMonitor, giving visibility into traffic flows, latency, and mesh topology.
The result is a lightweight, secure, and scalable service mesh with reduced resource overhead, faster pod startup, and simplified management while retaining zero-trust security and full observability across the OpenShift cluster.
To make your learning easier, you also can find the full source code on my GitHub repo, https://github.com/secangkirkopipanas/ossm3-ambient.
I’m a cloud-native software architect passionate about building resilient, scalable systems. My work focuses on Java and modern frameworks like Quarkus, Spring, microservices architecture, Kubernetes, Service Mesh, and DevSecOps automation. I’m currently working as Consulting Architect in Red Hat Asia Pacific.